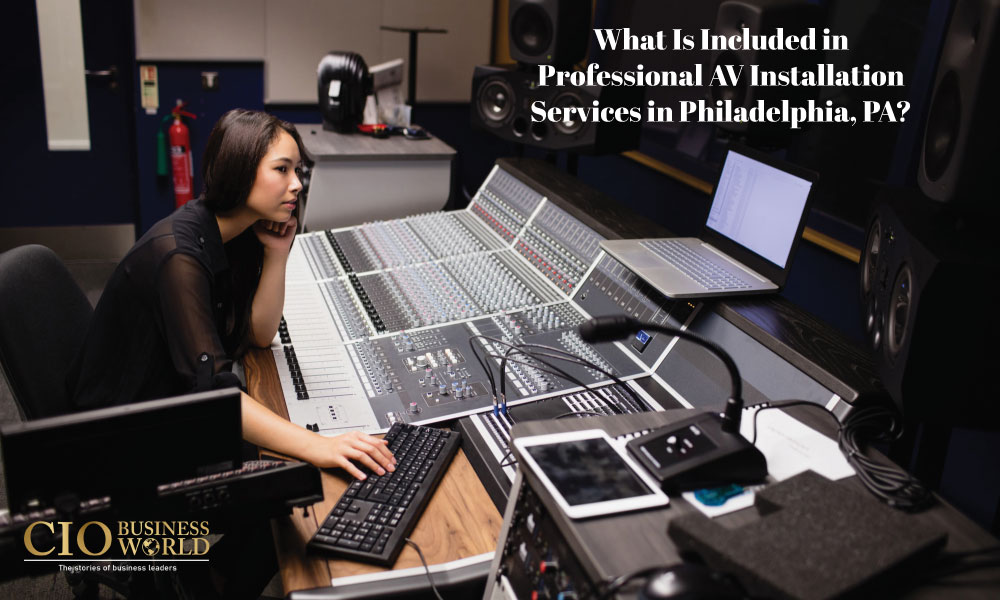
Advertise With Us

Optimizing Enterprise IT Procurement and Vendor Budgets

Managing large corporate technology contracts is a massive challenge for modern operations. Teams frequently juggle multiple software agreements, cloud subscriptions, and hardware replacements simultaneously. This complex web of services can quickly drain available funds if managers do not keep a close watch.

Finding smart ways to optimize enterprise IT procurement and vendor budgets can change how a firm operates. A strategic plan saves capital and helps teams acquire the exact tools they need. With a methodical approach, any organization can reclaim control over tech expenditures.

Smart Planning for Corporate Tech Infrastructure

Corporate leaders must establish a clear framework before purchasing new hardware or licensing expensive programs. Many managers look for corporate deals on the CouponChief official site to find discounts on everyday enterprise applications. This basic step keeps baseline costs low before major enterprise software deployments begin.

Reviewing current assets prevents companies from buying identical tools for different departments. Siloed teams often purchase separate solutions – a major source of waste – that perform the same functions. Gathering all department heads to coordinate procurement eliminates this unnecessary waste.

Tracking the Rise of Artificial Intelligence Expenses

New technology brings unexpected financial demands that corporate teams must address quickly. A recent industry report revealed that 98% of organizations now actively track their intelligence software costs, a massive jump from less than a third just two years ago. This rapid adoption requires immediate adjustments to traditional forecasting models.

Firms that fail to monitor these new deployments face severe budget overruns. Artificial intelligence tools require massive computational power, which scales up operational costs very quickly. Managers need to establish strict boundaries around usage to prevent surprise bills at the end of the month.

Modeling Consumption Against Complex Price Tiers

Understanding how a business uses its software helps negotiators secure better deals. A guide on cloud operations suggested that teams secure the most cost-effective contract terms by matching predicted usage against intricate price brackets. Predicting future needs accurately prevents the company from paying for unused seat licenses.

Many vendors structure their agreements with steep discounts for higher volume commitments. Still, committing to a high tier without sufficient demand creates waste. Leaders must analyze monthly telemetry data to determine their true infrastructure requirements. Reviewing these reports before signing any contract saves significant capital over the long run.

Visibility and Supplier Participation Drive Savings

Open communication with commercial partners yields surprising financial benefits during contract talks. An article on procurement trends showed that organizations can achieve 5% to 10% savings simply by opening up visibility and motivating deeper vendor involvement. Sharing long-term goals with external providers allows them to propose more affordable alternative solutions.

When multiple suppliers compete for enterprise contracts, price points naturally drop. Transparency during the bidding process encourages vendors to put forward their best offers early. This cooperative environment builds stronger relationships and saves thousands of $ on annual agreements. Procurement teams can then leverage these competitive bids to secure additional service perks.

Cost Reduction Goals for Modern Executives

Corporate leadership faces heavy pressure to streamline internal operations and protect profit margins. Data from a major executive survey indicated that 52% of technology leaders view lowering operational expenses as a primary objective for the coming two years. This corporate focus shifts attention away from reckless growth toward sustainable spending habits.

Achieving these goals requires a complete review of every active subscription. Teams must eliminate duplicate accounts and phase out legacy systems that require costly maintenance. Constant evaluation makes sure that tech investments deliver real, measurable value to the firm.

Managing Policies with Automated Workflows

Manual approval processes slow down operations and lead to costly human errors. A recent business technology publication explained that implementing automated workflows guarantees that purchases follow internal guidelines, which stops off-budget transactions. Standardized systems prevent individual employees from buying unauthorized applications on corporate credit cards.

Using structured systems offers several clear advantages for corporate spend control:

  • Automated alerts inform managers when a department approaches its monthly financial limit. This notice gives teams time to adjust habits before overages occur.
  • Digital records track every software transaction from request to final payment. These clear audit trails simplify future compliance reviews.
  • Pre-approved vendor catalogs speed up minor purchases for engineering teams. Employees get their tools quickly without bypassing core procurement channels.

Streamlining Onboarding Processes with Supplier Portals

Bringing new vendors into an enterprise system can take weeks without the right infrastructure. An administrative insight from an educational institution highlighted how online vendor portals automate onboarding and profile updates. Eliminating manual data entry allows procurement teams to focus on contract strategy.

Modern portals handle credential verification and tax documentation automatically. This automation reduces compliance risks and protects the company from fraudulent billing schemes. Seamless onboarding keeps suppliers happy and encourages better service terms during renewals. Clarity during onboarding establishes a professional standard right from the start.

Optimizing enterprise technology spending requires constant attention, clear policy enforcement, and smart automated tools. Tracking consumption data carefully helps organizations avoid unexpected budget surprises. Creating healthy competition among suppliers and automating basic approval steps keeps operational costs low. This structured approach protects corporate resources and supports long-term financial stability.

Stormwater Rules Are Costing US Contractors $10,000 a Day in Fines

Construction firms across America are discovering that ignoring stormwater regulations carries a price tag far steeper than expected. While most contractors focus on traditional safety concerns and project deadlines, a growing number are finding themselves hit with penalties that can rapidly escalate into six-figure violations, threatening both profitability and business continuity.

The financial reality is stark.

EPA fines for SWPPP violations can reach up to $56,460 per day per violation, a number that represents the maximum federal penalty for Clean Water Act infractions. However, most contractors face penalties starting around $10,000 daily when violations are discovered, with costs compounding quickly when multiple issues exist on a single site or when violations persist across inspection periods.

The Compliance Gap That’s Bleeding Budgets

Understanding why these fines occur starts with recognizing what regulators expect.

Since 1992, United States EPA regulations have required that operators of construction activity that involves more than one acre must control stormwater leaving the construction site through use of a Construction General Permit (CGP) and a Stormwater Pollution Prevention Plan (SWPPP). Despite three decades of this requirement being in effect, compliance remains inconsistent across the industry.

The problem extends beyond federal oversight. State agencies add their own enforcement layer, creating a complex regulatory web.

State agencies like the Texas Commission on Environmental Quality (TCEQ) also impose steep penalties, often working in tandem with EPA inspectors to identify violations that contractors miss during their own site reviews.

Many construction companies underestimate how quickly inspectors can identify problems. Unlike scheduled safety audits,

EPA and state inspectors can visit your site at any time, especially after heavy rain events that can reveal SWPPP violations. A single rainstorm that washes sediment into nearby waterways can trigger complaints from the public, environmental groups, or downstream property owners, all of which can prompt immediate regulatory attention.

When One Mistake Triggers Multiple Violations

The mathematics of stormwater penalties work against contractors in ways that might surprise those unfamiliar with enforcement patterns. Regulators don’t just cite a single violation when they find problems. Instead, they often identify multiple infractions during one inspection.

Common violations include inadequate SWPPPs, inadequate documentation of inspections after heavy rainfall or failure to document corrective actions, and effluent limitation violations.

Each deficiency carries its own penalty calculation. A contractor might receive citations for failing to install proper erosion controls, neglecting required inspections, maintaining inadequate documentation, and allowing prohibited discharges all on the same day. When inspectors return for follow-up visits,

each inspection, no matter how many days apart they are, is considered a separate incident that has its own fees and penalties included.

Real Cases, Real Costs

Recent enforcement actions demonstrate how quickly costs accumulate.

In 2020, four solar energy companies were accused of violating the Clean Water Act by failing to meet stormwater permit requirements during the construction of large-scale solar energy facilities. These companies ultimately agreed to pay a collective $1.34 million to settle the allegations.

Transportation companies face similar exposure.

A multi-state freight carrier agreed to pay $535,000 in civil penalty and implement a comprehensive, corporate-wide stormwater compliance program after the company allowed spills to go unaddressed, failed to implement required spill prevention and control measures, missed required monitoring events, and did not adequately train employees.

These settlements represent just the tip of the financial iceberg. Beyond the direct fines, companies absorb additional costs for legal representation, remediation work, enhanced compliance programs, and the opportunity cost of diverted management attention. Projects can face stop-work orders that delay completion schedules and trigger penalty clauses in contracts with clients.

The Documentation Deficit

One of the most common violations stems from inadequate recordkeeping rather than actual environmental damage. Contractors who implement physical controls like silt fences and sediment basins still face penalties when they fail to document inspections properly or maintain required monitoring records. The regulatory framework demands both physical compliance and paper trails proving that compliance.

Pro SWPPP solutions have emerged to help contractors navigate these documentation requirements, offering systematic approaches to tracking the inspections and maintenance activities that regulators expect to see. Without proper systems, even contractors with good intentions struggle to maintain the consistent documentation standards that keep them out of enforcement actions.

The Hidden Costs Beyond Direct Fines

Smart business leaders understand that regulatory fines represent only one dimension of the true cost of non-compliance. 

If your company is known for cutting corners on SWPPP compliance, you might struggle to win bids or attract clients who prioritize sustainability. Many large corporations and investors now consider Environmental, Social, and Governance (ESG) factors when choosing contractors. A history of SWPPP violations can make your company look risky or unreliable.

Insurance carriers also pay attention to environmental compliance records. Contractors with multiple violations may face increased premiums or difficulty securing coverage for future projects. Some general contractors now require subcontractors to demonstrate clean compliance records before awarding work, effectively turning stormwater violations into a competitive disadvantage in the bidding process.

Cascading Regulatory Attention

Another hidden cost emerges when one type of violation attracts scrutiny to other areas of operations.

If you got in trouble for one thing, expect regulators to scrutinize everything. For example, if you had someone raising issues about NPDES stormwater permit compliance, you could expect those regulators to also start looking into air permit compliance levels, or if you need a SPCC Plan, if you should be conducting any type of EPCRA reporting, or if you need anything else. If you get dinged for one thing, expect to get dinged for EVERYTHING.

This pattern of expanded enforcement means a stormwater violation can become the entry point for comprehensive regulatory audits covering worker safety, air quality, hazardous waste management, and other environmental concerns. Each additional area of inspection creates more opportunities for citations and penalties.

Prevention Strategies That Actually Work

Forward-thinking contractors are shifting their approach from reactive compliance to proactive prevention. This starts with understanding that stormwater permit requirements demand both initial coverage before ground disturbance begins and ongoing maintenance of control measures throughout construction.

Training represents the foundation of effective compliance programs.

The compliance program should include better documentation of stormwater operating procedures, roles, and responsibilities; comprehensive employee and contractor training; and tracking of facility-specific corrective actions. When every person on site understands their role in stormwater protection, from equipment operators to project managers, the likelihood of violations decreases substantially.

Technology plays an increasingly important role in maintaining compliance. Mobile apps enable real-time documentation of inspections, photo evidence of control measures, and immediate notification when maintenance is needed. GPS-enabled check-in systems can verify that inspections occur on schedule, while weather monitoring integrations can trigger automatic reminders when rainfall requires follow-up inspections.

The Economics of Compliance Investment

While implementing robust stormwater programs requires upfront investment, the economics favor prevention over penalties. A comprehensive SWPPP development, staff training, and ongoing inspection services typically cost a fraction of a single EPA fine. When contractors calculate the true return on investment, preventing even one $10,000 daily violation justifies significant compliance expenditures.

The calculation becomes even more favorable when considering that environmental compliance statistics from various regulatory frameworks show that businesses with strong compliance cultures avoid not just fines but also the reputational damage and operational disruptions that violations create.

Building Compliance into Company Culture

The most successful construction firms treat stormwater compliance not as a separate regulatory burden but as an integrated component of project management and site operations. This means including SWPPP requirements in project scheduling from the earliest planning stages, budgeting adequately for compliance measures, and making environmental protection a key performance indicator for project managers and superintendents.

Regular internal audits help identify potential problems before regulators arrive. These self-assessments create opportunities to correct deficiencies proactively, demonstrating good faith efforts that can influence penalty calculations if violations do occur. Contractors who can show a history of self-correction and continuous improvement often receive more favorable treatment in enforcement proceedings.

Communication between field staff and management remains critical. When equipment operators observe potential problems like failing silt fences or sediment tracking onto public roads, they need clear channels to report issues and confidence that reporting will lead to prompt corrections rather than blame. This cultural shift requires leadership commitment and consistent messaging that compliance protects both the environment and the company’s financial health.

Partnerships with specialized compliance consultants can provide expertise that internal staff may lack, particularly for contractors who work across multiple states with varying requirements. These relationships help navigate the complexity of overlapping federal, state, and local regulations while keeping pace with evolving requirements and enforcement priorities.

The construction industry faces mounting pressure to demonstrate environmental responsibility while delivering projects on time and within budget. Stormwater compliance represents one area where cutting corners creates unacceptable financial and reputational risks. With penalties reaching thousands of dollars per day and enforcement becoming more sophisticated, contractors need to approach stormwater protection with the same rigor they apply to safety programs and quality control. 

Those who do will not only avoid costly fines but position themselves as preferred partners for clients who increasingly demand environmental excellence alongside construction expertise.

Corporate Retreat Budgets Are Shifting to River Cruises

Corporate event planners are steering budgets away from traditional conference centers and looking to the waterways. 

River cruises have emerged as a compelling alternative for executive retreats, team-building events, and corporate incentive programs as companies seek to maximize the value of every event dollar while creating experiences that actually resonate with employees.

The numbers tell the story.

Corporate event spending is expected to rise in 2026, with costs reaching $169 per attendee per day, pushing planners to seek venues that bundle accommodation, dining, transportation, and meeting space into a single package. River cruises deliver precisely that combination.

The Business Case Behind the Shift

River cruising is outpacing the cruise market as a whole with bookings tracking 36% above expectations, and a significant portion of that growth stems from corporate clients. Traditional hotels and resort venues require companies to coordinate multiple vendors, manage separate contracts for food and beverage, arrange ground transportation, and hope all the pieces align. River cruises eliminate that complexity.

The floating venue model offers something conference centers cannot: a constantly changing backdrop that keeps attendees engaged while maintaining the intimacy necessary for productive work sessions.

Most river ships carry roughly 100 to 200 guests, making them ideal for corporate groups that need private space without the distraction of thousands of other passengers.

Following the Dollars

The corporate travel sector recovered robustly following pandemic disruptions.

Global business tourism spending was estimated to reach approximately 1.5 trillion U.S. dollars in 2024, which represents a full recovery from the COVID-19 pandemic. Companies are spending again, but they are spending strategically.

European destinations have long dominated the river cruise market, but corporate planners increasingly view these itineraries as dual-purpose investments. Teams can conduct strategic planning sessions during morning cruising hours, then step directly into culturally rich cities for afternoon team-building experiences without the logistical burden of buses, transfers, or navigation.

The productivity advantage matters. Workplace productivity experts at the U.S. Bureau of Labor Statistics have documented how changes in work environment affect output, and the confined yet comfortable setting of a river ship creates natural opportunities for focused collaboration. Meeting rooms sit steps away from dining areas and guest accommodations, reducing transition time and keeping teams concentrated on objectives.

Market Momentum Accelerating

Industry data confirms the corporate appetite for river cruises continues to build.

Viking, the river cruise market leader, reported 2026 sales pacing double digits ahead of 2025, with 10 new ships being added to its fleet by 2027. That expansion responds directly to corporate demand alongside traditional leisure travelers.

Tauck reported 2026 bookings pacing nearly 30% ahead of 2025 bookings, while Riviera Travel said 2026 river cruise bookings are 42% higher than 2025 bookings were at this time last year. The corporate segment drives much of that surge, particularly for shoulder-season departures when pricing becomes more favorable for budget-conscious planners.

One significant factor fueling the shift involves cost transparency. River cruise pricing typically bundles accommodation, meals, excursions, and onboard amenities into a single per-person rate. Finance teams appreciate the simplified budgeting model compared to traditional venues where costs stack incrementally and unpredictably.

The Operational Simplicity Factor

Corporate event success depends on execution, and river cruises streamline the operational burden considerably.

The format allows planners to schedule short business sessions in the morning, then free the afternoon for experiences ashore, with work getting done in a setting that feels very different from an office.

This structure addresses a persistent challenge in corporate event planning: balancing professional objectives with the employee experience expectations that drive engagement and retention. Corporate event trends reflect growing pressure on executives to demonstrate measurable return on investment from retreat spending, not just in immediate business outcomes but in long-term talent retention.

The hospitality infrastructure aboard river vessels aligns naturally with corporate needs. Ships feature flexible meeting spaces, audio-visual equipment, reliable Wi-Fi connectivity, and dedicated event staff accustomed to managing business groups. The all-inclusive model means fewer surprise expenses bleeding into budgets mid-event.

Data-Driven Decision Making

Business travel statistics paint a clear picture of corporate spending patterns, and river cruises fit squarely within the premium tier that companies reserve for high-value events. The format works particularly well for executive leadership retreats, board meetings, top-performer reward programs, and strategic planning sessions where privacy and focus matter.

New entrants like Transcend Cruises, founded in 2022, are launching luxury river cruise vessels exclusively for corporate groups, with the first ship hitting the water in April 2026. This specialized approach signals industry recognition that corporate clients represent a distinct segment with specific requirements.

The scheduling flexibility river cruises offer creates additional appeal. Unlike destination resorts that require year-ahead bookings for peak dates, river cruise operators can often accommodate corporate groups with shorter lead times, particularly for European itineraries during spring and fall shoulder seasons when rates drop but weather remains favorable.

Looking Forward

The confluence of rising corporate event costs, demand for simplified logistics, and the proven appeal of experiential rewards positions river cruises for continued growth in the corporate market. Companies need venues that justify the investment, engage participants meaningfully, and deliver outcomes that extend beyond the event itself.

River cruises check those boxes while solving practical problems that plague traditional corporate retreats. The format eliminates decision fatigue about where to eat, how to get between venues, and which activities to schedule. Everything happens within a compact, controlled environment that keeps teams focused without feeling constrained.

As corporate travel budgets stabilize and companies refine their approach to in-person gatherings, river cruises offer a value proposition that resonates: premium experiences wrapped in operational simplicity, delivered at competitive per-person costs when properly compared to full-service resort alternatives.

The waterways are becoming boardrooms, and the current is flowing decisively in that direction.

Hidden Cost in Every Online Donation Most Nonprofits Ignore

Every dollar matters when you’re running a nonprofit. But while most organizations obsess over program costs and administrative overhead, they’re quietly losing thousands to a category that rarely makes it into board discussions: payment processing fees.

When a supporter clicks “donate” on your website, that contribution immediately enters a complex payment infrastructure where multiple parties take their cut before the money reaches your bank account.

Nonprofits collectively pay an estimated $1.43 billion annually in credit card processing fees on online donations across North America, yet most organizations lack a clear strategy to minimize this expense.

The true financial impact extends far beyond the advertised rates. Understanding the full scope of these costs and implementing strategic approaches to reduce them could mean the difference between expanding services and cutting programs.

The Real Math Behind Processing Fees

Processing fees typically consist of 2-3% of the donation amount, plus a small flat fee per transaction. That percentage might seem negligible on paper, but the cumulative effect tells a different story.

Consider a mid-sized organization raising $50,000 through online campaigns.

With an effective processing rate of 5-7%, that campaign could result in approximately $2,500-$3,500 in combined transaction and platform costs before funds reach programs. For an organization operating on tight margins, that’s enough to fund significant program expansion or staff support.

The impact becomes even more pronounced when examining smaller donations.

A campaign raising $5,000 from 200 gifts averaging $25 could lose $170 to processing fees alone. That lost revenue compounds across multiple campaigns throughout the year, creating a substantial drain on mission-critical resources.

The Hidden Layers Most Organizations Miss

The advertised processing rate represents only one component of the total cost. Most nonprofit payment platform arrangements include multiple fee layers that aren’t immediately obvious.

Payment processors include hidden costs beyond the expected payment, which vary depending on card type, payment method, and currency, including transaction fees, monthly fees, platform fees, chargeback fees, and international conversion fees. These additional charges create complexity that makes true cost comparison between platforms challenging.

Platform fees deserve particular scrutiny.

Some platforms charge a 4% transaction fee, a 2.2% platform fee, and a potential payment processing fee up to 3.2%. That layered structure means what appeared to be a competitive rate actually results in significantly higher total costs.

Tax-deductible contributions to qualified 501(c)(3) organizations provide donors with valuable benefits, making fee transparency even more critical for maintaining trust. Organizations must clearly communicate how much of each donation reaches programs versus administrative costs.

Strategic Approaches to Reduce Payment Processing Costs

Forward-thinking organizations are implementing specific strategies to retain more of each contribution.

The most effective approach involves offering donors the option to cover processing fees.

Studies show that donors, when presented with the option, choose to cover processing fees 50-65% of the time. This simple checkbox addition to donation forms can recover thousands in otherwise lost revenue annually.

Payment method diversification offers another opportunity for cost reduction. While credit cards remain the most popular donation method, alternative payment options like ACH transfers carry significantly lower fees. Organizations that prominently feature bank transfer options for larger gifts or recurring donations can achieve substantial savings.

Negotiating specialized nonprofit rates represents another critical strategy.

Credit card processing fees for nonprofits range from 2.2% plus 30 cents to 3.5% plus 30 cents, and card networks publish lower interchange rates for nonprofits than for commercial merchants, which directly reduces total processing costs. However, organizations must actively apply for these discounted rates rather than assuming they’ll be automatically applied.

Technology Infrastructure Choices Matter

The decision between bundled donation platforms and modular payment systems carries long-term financial implications that extend beyond monthly subscription fees.

All-in-one platforms offer convenience but often include platform fees that stack on top of standard processing charges.

Monthly subscription fees for nonprofit donation platforms typically range from $50 to $500 per month, and a nonprofit processing $1 million in donations could lose between $37,200 and $91,200 annually when combined with transaction fees.

Organizations with technical capacity increasingly opt for direct payment processor integration, eliminating the middle layer. This approach requires more initial setup but provides greater control over the donor experience while reducing total fees paid per transaction.

The platform selection process should include calculating the effective rate across expected donation volumes rather than comparing advertised rates alone. A platform with a higher transaction fee but no monthly subscription might prove more economical for organizations with variable donation patterns, while high-volume processors benefit from negotiated interchange-plus pricing structures.

Building Donor Communication Around Fee Coverage

Successfully implementing fee coverage options requires thoughtful communication that respects donor autonomy while clearly explaining impact.

The most effective approaches emphasize transparency and choice. Rather than pre-checking the fee coverage box, organizations should present it as an optional way to maximize gift impact. Clear language like “Cover the processing fee so 100% of my donation supports programs” performs better than vague requests to “help with costs.”

Transparency extends beyond the donation form itself. Organizations should regularly communicate the total amount saved through donor fee coverage in impact reports and annual communications. This acknowledgment reinforces the value of that additional giving while building trust through openness about operational realities.

The tax implications of fee coverage also require clear communication. While the additional amount typically qualifies as part of the tax-deductible contribution, organizations should provide clear documentation that separates the base donation from the fee coverage amount in receipts.

The Compounding Effect on Mission Impact

The cumulative financial impact of unmanaged processing fees extends well beyond immediate budget implications. Over a five-year period, an organization processing moderate donation volumes could see six-figure losses to fees that receive minimal strategic attention.

Across high-volume online fundraising efforts, combined processing and platform costs can reasonably total 5-10% or more of online donation revenue, and credit card processing fees influence how nonprofits plan, grow, and evaluate online fundraising. That percentage represents funding that could support program expansion, staff development, or operational reserves instead of payment infrastructure costs.

The strategic response requires treating payment processing as a financial operations decision rather than a technical implementation detail. Board finance committees should regularly review total processing costs as a percentage of online revenue and evaluate whether current arrangements optimize value. Annual benchmarking against industry standards helps identify opportunities for improvement through renegotiation or platform changes.

Organizations that implement comprehensive fee management strategies typically recover 3-5% of their online donation revenue that would otherwise go to processing costs. For most nonprofits, that translates to meaningful program expansion capacity generated through operational optimization rather than fundraising growth.

Moving Forward With Fee Management

The payment processing landscape continues to evolve, with new platforms and pricing models emerging regularly. Organizations benefit from annual reviews of their payment infrastructure to ensure they’re leveraging the most cost-effective solutions available for their donation volume and patterns.

The conversation around processing fees should extend beyond internal operations to include board members, major donors, and funding partners. Transparency about these costs builds credibility while creating opportunities for supporters to help offset them through fee coverage or technology grants.

Processing fees represent one of the few nonprofit expenses that can be directly offset through donor participation. Organizations that clearly communicate this opportunity while providing excellent giving experiences typically see majority participation in fee coverage programs, effectively eliminating this cost category while strengthening donor relationships through increased transparency.

The path forward requires acknowledging that while processing fees are unavoidable in digital fundraising, they need not represent pure loss. Strategic fee management, donor engagement around coverage, and regular infrastructure optimization transform this hidden cost into a manageable operational element rather than an ignored drain on mission resources.

How Enterprises Actually Scrape Public Data at Scale Without Getting Blocked

The global market for enterprise data extraction has become a billion-dollar battleground where conventional approaches fail within minutes. 

Companies running high-volume collection pipelines face sophisticated detection systems that analyze dozens of signals simultaneously, making successful data acquisition a complex technical challenge that demands layered defense strategies and constant adaptation.

Modern anti-bot systems from Cloudflare, Akamai, and DataDome now operate across multiple detection layers. These platforms analyze IP reputation scores, TLS fingerprints, browser environment characteristics, and behavioral patterns to identify automated traffic before returning a single line of HTML. What worked for small-scale scraping operations three years ago gets blocked at enterprise volume today.

The Infrastructure Reality Behind Million-Request Operations

Large organizations handle scraping through distributed architectures designed for resilience rather than speed alone. Success at scale requires understanding that blocking mechanisms target predictable patterns, not individual requests. Enterprises deploying proxy rotation infrastructure combine this with adaptive user agents, randomized headers, and behavioral simulation to mimic legitimate traffic patterns.

The technical reality involves maintaining pools of thousands of IP addresses that rotate either per request or through sticky sessions lasting several minutes. Request timing matters as much as IP diversity. Systems firing requests at exactly one-second intervals trigger immediate flags, while adding randomized delays between two and ten seconds creates traffic patterns that resemble human browsing behavior.

Enterprise scraping infrastructure separates I/O-bound network operations from CPU-intensive parsing tasks. Organizations use asyncio patterns for concurrent requests while processing extracted data through separate multiprocessing workflows. This architectural separation prevents bottlenecks and allows horizontal scaling across distributed nodes without rebuilding core infrastructure.

Detection Layers Enterprises Must Navigate Simultaneously

Websites detect scrapers through IP reputation databases that track request patterns across millions of domains. Repeated requests from datacenter IP ranges get flagged faster than traffic originating from residential addresses assigned by Internet Service Providers. Anti-bot systems maintain historical scoring, meaning a single IP address used aggressively across multiple targets can poison future requests even on unrelated domains.

TLS fingerprinting examines the cryptographic handshake that occurs before any HTTP traffic begins. Standard HTTP clients like Python’s requests library always negotiate the same cipher suites in the same order, creating a reliable detection signal. Modern bypass techniques require matching the TLS fingerprint of real browsers, including supported protocols, extension order, and elliptic curve preferences.

Browser fingerprinting goes deeper than User-Agent strings. Digital economy enterprises face JavaScript-based detection that examines navigator.webdriver flags, canvas rendering outputs, WebGL GPU strings, installed fonts, screen resolution, audio context behavior, and plugin configurations. Headless Chrome exposes itself through dozens of JavaScript signals that anti-bot systems check milliseconds after page load.

Behavioral analysis tracks mouse movements, scroll patterns, click behavior, inter-request timing, navigation depth, and session duration. Systems like PerimeterX and HUMAN measure these patterns across entire sessions rather than individual requests. A scraper that never scrolls, never moves a mouse, and jumps directly to deep product pages without visiting a homepage reveals itself through the absence of human-like interaction patterns.

Rate Limiting and Request Management at Production Scale

Federal guidelines recommend that agencies use Robots Exclusion Protocol (robots.txt) and respect website terms of service for all web scraping activities. Commercial enterprises operating within legal boundaries implement similar respect for server resources while maximizing collection efficiency.

Organizations deploy exponential backoff with jitter when encountering rate limits. Instead of retrying failed requests immediately, systems wait progressively longer periods with randomized delays. This approach prevents the thundering herd problem where multiple failed requests create additional load spikes that trigger deeper blocking.

Circuit breaker patterns provide automated failure recovery. When success rates drop below defined thresholds, the system pauses requests to specific domains, rotates to different IP pools, and tests with reduced concurrency before resuming full-scale operations. This systematic approach enables rapid response to blocking events without manual intervention.

Token bucket rate limiting allows burst traffic while maintaining average request rates below detection thresholds. Organizations configure buckets that refill at rates matching target site capacity, ensuring sustained access without triggering abuse detection systems. Advanced implementations adjust bucket parameters dynamically based on response headers and observed blocking patterns.

The Choice Between Building and Buying at Enterprise Scale

Organizations face a fundamental decision when deploying data collection operations at scale. Building in-house infrastructure requires maintaining proxy networks, updating stealth plugins, managing fingerprint rotation, integrating CAPTCHA solvers, and continuously adapting to evolving anti-bot systems. This operational overhead diverts engineering resources from core business objectives.

Research institutions and academic teams often develop custom solutions using frameworks like Beautiful Soup, Scrapy, or Puppeteer combined with residential proxy services. These approaches work well for research projects with hundreds or thousands of daily requests but struggle when scaling to millions of data points across hundreds of target domains.

Managed scraping services consolidate IP rotation, TLS fingerprint management, CAPTCHA solving, and browser rendering into single API calls. Organizations using these platforms pay premium pricing but eliminate infrastructure maintenance, reduce blocking-related failures, and achieve higher success rates on protected targets. The cost-benefit calculation depends on internal engineering capacity versus data acquisition urgency.

The proxy infrastructure alone presents significant complexity. Residential proxy networks require pools of millions of IP addresses distributed across geographic regions, with geolocation targeting down to city and carrier level. Maintaining high success rates demands continuous pool health monitoring, automatic removal of compromised addresses, and session management that balances rotation speed against site-specific authentication requirements.

Monitoring, Compliance, and Operational Continuity

Successful enterprise scraping operations implement comprehensive monitoring covering success rates, response times, proxy performance, CAPTCHA frequency, and data quality indicators. Real-time dashboards enable rapid detection of blocking events and provide metrics for optimizing extraction strategies across different target types.

Organizations track leading indicators rather than lagging ones to measure project health. Monitoring changes in average response times, shifts in CAPTCHA presentation rates, and increases in authentication challenges provides early warning of emerging blocking patterns before collection pipelines fail completely.

Data validation ensures extraction accuracy throughout the collection lifecycle. Organizations implement schema checks, completeness validation, and cross-source verification to identify when scraped data no longer matches expected formats. These quality gates catch subtle blocking mechanisms that return partial or modified content rather than outright denials.

Compliance frameworks govern enterprise data collection activities. Organizations document data sources, maintain records of terms of service reviews, implement privacy controls for any collected personal information, and establish data retention policies aligned with regulatory requirements. These governance structures protect both the organization and data subjects while enabling legitimate business intelligence gathering.

The technical infrastructure supporting enterprise-scale scraping continues evolving as anti-bot systems deploy more sophisticated detection mechanisms. Organizations maintaining successful data collection operations balance technical bypass strategies with ethical practices, legal compliance, and respect for server resources. This approach enables sustainable access to public data while minimizing risks to both the enterprise and target platforms.

The Online Engineering Degree That Defense Contractors Are Funding

The aerospace and defense industry faces a workforce crisis that could ground innovation for years to come. With one in four aerospace engineers over age 55 and an estimated shortage of more than one million engineers projected by 2030, major defense contractors are taking an unconventional approach to solving the talent gap. 

They are directly funding online engineering degrees for current and prospective employees, transforming higher education into a strategic workforce pipeline.

The Talent Crisis Gripping Defense Contractors

About one-third of all aerospace and defense manufacturing and engineering roles are filled by workers who are 55 or older, creating a retirement cliff that threatens critical defense programs.

According to the Aerospace Industries Association, of the 70,000 engineers graduating annually in the U.S., only 44,000 are qualified to work in aerospace, and U.S. companies face stiff competition for these candidates from major tech firms like Amazon and Apple.

The competition for talent has become one of the fiercest operational constraints facing the industry. Defense contractors must compete not only with each other but also with technology giants offering comparable salaries without the security clearance requirements and regulatory compliance burdens that characterize defense work. This talent squeeze is happening precisely when demand is surging across commercial aviation, space exploration, and military modernization programs.

How Major Contractors Fund Employee Education

The largest defense contractors have implemented comprehensive tuition assistance programs that extend well beyond traditional reimbursement models.

Boeing offers $30,000 per year, Raytheon provides $25,000 per year, and Lockheed Martin offers $15,000 per year for engineering degrees, with some programs featuring no lifetime caps for STEM disciplines.

Boeing’s Learning Together Program has no annual funding cap for eligible STEM degree and certificate programs at hundreds of partner schools, and Boeing pays the full tuition directly to the school. This direct-payment model eliminates the cash flow problem that makes traditional reimbursement programs impractical for many working adults who cannot afford to pay thousands of dollars upfront while waiting months for reimbursement.

online master’s programs in aerospace engineering have become particularly attractive to defense contractors because they allow employees to continue working full-time while pursuing advanced credentials. The flexibility of asynchronous coursework enables engineers to maintain security clearances and project continuity while developing specialized skills in areas like hypersonics, autonomous systems, and space technologies.

The UCF Model: Feeding the Defense Pipeline

UCF has been named the No. 1 supplier of graduates to the aerospace and defense industries for six consecutive years by Aviation Week Network. The university has built a comprehensive ecosystem connecting students directly to major contractors through work experience programs, research partnerships, and co-location strategies.

The Lockheed Martin College Work Experience Program at the University of Central Florida has helped thousands of students from various disciplines build careers in global security and aerospace engineering for more than 40 years.

Lockheed Martin expanded investments in this highly successful program after designating UCF as one of only 12 university strategic partners committed to supporting Lockheed Martin as the world’s largest aerospace and defense corporation.

The partnership goes beyond simple hiring pipelines.

UCF received $37.5 million from the U.S. Department of Defense in 2023 for research projects ranging from making faster computers to continuing work in the area of lasers and photonics. This funding creates a virtuous cycle where research opportunities attract talent, industry partnerships provide practical experience, and defense funding supports the infrastructure needed to train the next generation of engineers.

Understanding workforce development trends helps explain why defense contractors are investing so heavily in employee education programs. The model mirrors broader corporate strategies for building internal talent pipelines when external hiring cannot meet demand.

Government Data Confirms Growing Demand

Employment of aerospace engineers is projected to grow 6 percent from 2024 to 2034, faster than the average for all occupations, according to Bureau of Labor Statistics projections.

About 4,500 openings for aerospace engineers are projected each year on average over the decade.

The median annual wage for aerospace engineers was $134,830 in May 2024, making these positions among the highest-paid engineering specialties. The combination of strong wages, job security, and meaningful work on national defense programs makes aerospace engineering attractive to prospective students, but the lengthy education requirements and security clearance processes create significant barriers to entry.

The defense industry’s solution has been to identify promising talent early, provide financial support for education, and create pathways that allow employees to gain clearances and experience while completing their degrees. This approach reduces the time from initial interest to productive contribution from potentially eight years or more to as little as four years for employees who pursue education while working.

The Strategic Calculation Behind Education Funding

Defense contractors are not funding education out of altruism. The business case is straightforward and compelling.

Unlike other industries where labor shortages can be addressed through immigration, wage increases, or accelerated training, defense cleared roles face a unique bottleneck because the clearance pipeline is controlled by a government agency with its own capacity limits, and firms cannot hire their way out of a clearance backlog.

By investing in education for existing employees or promising candidates early in their careers, contractors accomplish several objectives simultaneously. They build loyalty among employees who receive substantial financial benefits. They create a talent pool with the specific technical skills needed for proprietary systems and classified programs. Most importantly, they can sponsor security clearances proactively, positioning themselves to capture revenue when major programs ramp up rather than scrambling to find cleared personnel in a constrained market.

The education investment also serves as a retention tool.

Like Lockheed Martin and Boeing, most programs tie funding to job relevance and may include continued employment expectations after receiving benefits, with companies emphasizing STEM and technical advancement. This creates a natural retention mechanism where employees who accept education funding are incentivized to remain with the company long enough to avoid repayment obligations.

A New Model for Workforce Development

The defense industry’s approach to funding online engineering degrees represents a fundamental shift in how corporations think about talent development. Rather than competing for finished products in a constrained labor market, leading contractors are investing in the production process itself.

This model is expanding beyond traditional engineering disciplines. Contractors are funding degrees in cybersecurity, data science, systems engineering, and other technical fields critical to modern defense systems. The online format makes these programs accessible to mid-career professionals who cannot relocate or take time away from work, dramatically expanding the potential talent pool.

The aerospace workforce crisis that seemed insurmountable just a few years ago now has a clear solution taking shape. Major contractors are betting that strategic investments in employee education will build the specialized talent pipeline they need to execute increasingly complex defense programs. For students and working professionals, this creates unprecedented opportunities to pursue advanced engineering credentials with substantial financial support, meaningful work, and clear career progression in an industry facing decades of sustained demand.

The question is no longer whether defense contractors will fund online engineering degrees. The question is whether universities can scale these programs fast enough to meet the industry’s voracious appetite for qualified engineers.

The Pacific Northwest City Where Remote-First Companies Are Planting Roots

Portland, Oregon has emerged as an unexpected haven for remote-first companies seeking to establish their physical headquarters while maintaining distributed workforces. 

The city’s combination of tech infrastructure, quality of life, and business-friendly environment is attracting companies that have reimagined how work gets done in the digital age.

The Silicon Forest Evolves Beyond Physical Presence

Long known as the “Silicon Forest” for its concentration of semiconductor and tech companies, Portland is experiencing a fundamental transformation.

The tech industry in Portland is booming in 2025, with an 8% growth rate in 2023, exceeding the national average.

But this growth looks different than previous decades. Rather than simply adding workers to crowded campuses, companies are establishing headquarters that serve as collaboration hubs rather than daily destinations for most employees.

Portland-based ConductorOne, founded by serial entrepreneurs and former Okta executives, has 40 engineers in SE Portland and nearly 200 employees worldwide.

The company exemplifies the new model where physical presence anchors corporate identity while the majority of work happens remotely. This arrangement allows companies to tap global talent pools while maintaining a strategic base in the Pacific Northwest.

Portland’s appeal for these relocating operations extends beyond simple cost calculations.

Portland is home to over 1,200 tech companies, and the city’s tech labor pool expanded by 28% from 2016 to 2021, with an estimated 73,100 new tech jobs expected by 2033.

The existing talent pipeline creates opportunities for in-person collaboration when needed while supporting predominantly remote operations.

Why Remote-First Companies Choose Portland

The decision to establish headquarters in Portland reflects careful strategic thinking by companies committed to distributed work. Unlike traditional tech hubs where high costs force companies to justify expensive office spaces, Portland offers a middle path. Companies can maintain a meaningful physical presence without the pressure to fill seats simply to justify real estate investments.

Average salaries range from $89,000 to $148,000, with roles in AI and cloud architecture commanding top compensation.

These figures represent genuine value propositions where employees can build comfortable lives without the crushing housing costs of San Francisco or Seattle. The same economic logic applies to companies establishing operations. Economic development initiatives in the region support businesses that contribute to the local economy without requiring massive workforce concentrations.

56% of companies offer hybrid work options, emphasizing employee satisfaction and innovation.

This statistic reflects a broader cultural shift in Portland’s business community. The city has become comfortable with flexible arrangements that previous generations of business leaders might have considered impractical.

Infrastructure Supporting Distributed Operations

Remote-first companies require different infrastructure than traditional businesses. Portland has adapted to meet these needs through investments in digital connectivity, coworking spaces, and occasional-use facilities.

The Seattle area concentration of experienced engineers from companies like Microsoft and Amazon who know how to “build and operate at massive scale” extends into Portland, where engineers have shipped real products at scale, not just written code.

The infrastructure extends beyond technology.

Portland added 1,435 people between July 2023 and July 2024, for an estimated population of nearly 635,750, according to the U.S. Census Bureau.

This stabilization after pandemic-era population loss signals renewed confidence in the region’s economic prospects.

Companies establishing headquarters in Portland benefit from the city’s position as a regional economic center with established business services, professional networks, and cultural amenities. The city offers the gravitas of a proper headquarters without requiring companies to compromise on their commitment to remote work.

The New Generation of Portland Tech Companies

The companies setting up shop in Portland represent diverse sectors unified by their embrace of distributed work models.

Portland-based Customer.io has a global team of 350 and has blown past $100M in ARR.

The company’s success demonstrates that remote-first operations can scale to significant size while maintaining Portland headquarters.

Portland-based Hydrolix has more than 200 employees, greater than 100% YoY growth, and $80M on the balance sheet, and is on track to surpass a $1 billion valuation.

These valuations rival companies with traditional concentrated workforces, proving the remote-first model’s viability for venture-backed growth companies.

Digital transformation strategies have become central to how these companies operate. Leadership teams in Portland embrace technology not just as a product but as the foundation of their operational model. This creates natural synergies between company missions and organizational structures.

Challenges and Opportunities Ahead

Portland’s emergence as a remote-first headquarters hub faces real challenges.

The region lost jobs last year while the national labor market grew substantially, and the losses were concentrated in high-paying sectors like manufacturing, professional services, and financial services.

The transition from traditional employment models creates friction even as new opportunities emerge.

In 2019, just under 8% of Portland’s workforce normally worked from home, and this decline seems to be a result of working from home approaching an equilibrium in negotiating the wants and needs between employees and employers.

This equilibrium represents a new normal rather than a temporary adjustment. Companies establishing headquarters in Portland must navigate this landscape where remote work is expected rather than exceptional.

The opportunity lies in Portland’s willingness to adapt. Unlike cities fighting to restore pre-pandemic norms, Portland is embracing its role as a center for companies that have fundamentally rethought how and where work happens.

The region was recently highlighted by Acara Solutions as “one of the country’s best at supporting fast-growth entrepreneurs”, indicating a healthy and supportive startup ecosystem.

Building Community in a Distributed World

Remote-first companies face unique challenges in building organizational culture and community connections. Portland’s compact downtown, vibrant neighborhoods, and strong sense of place provide natural gathering points when distributed teams need face-to-face interaction.

Workers in the Portland-Vancouver-Hillsboro area had an average hourly wage of $36.77 in May 2024, compared to the nationwide average of labor statistics data of $32.66.

Companies are discovering that maintaining a headquarters in Portland creates identity and connection points that purely virtual operations struggle to achieve. The physical space serves as a symbol and occasional gathering place rather than a daily requirement. This approach satisfies both the practical demands of distributed work and the human need for place-based identity.

The broader Portland community benefits when companies choose to establish roots rather than remaining entirely virtual. Local spending, civic engagement, and cultural participation all increase when companies maintain meaningful local presence even with predominantly remote workforces.

Portland’s transformation into a hub for remote-first companies reflects broader changes in how businesses operate and where they choose to establish themselves. The city offers a compelling combination of talent, infrastructure, quality of life, and cultural acceptance of distributed work models. As more companies embrace remote-first operations while recognizing the value of physical headquarters, Portland’s positioning as a Pacific Northwest anchor for this new model appears increasingly strategic. The companies planting roots here today are defining what headquarters means in an age when presence is optional but place still matters.

Wellington Business Owners Are Ditching Big Four Firms for Mid-Tier Advisors

Business owners in Wellington are making a decisive shift away from large multinational accounting firms.

Recent research shows 80% of mid-tier firms have made at least one acquisition in the past year, with 67% planning further acquisitions within the next three years, driven primarily by growth in new clients. This consolidation reflects an increasing preference among small and medium-sized businesses to work with more agile, responsive advisors who can deliver personalized service without the Big Four price tag.

The trend marks a fundamental change in how Wellington’s entrepreneurial community approaches financial advisory. While Deloitte, PwC, EY, and KPMG once dominated the market for professional services, growing frustration with impersonal service, rigid processes, and premium fees has pushed business owners to explore alternatives. Mid-tier firms are capitalizing on this dissatisfaction by offering what the giants cannot: direct partner access, industry-specific expertise, and the flexibility to adapt quickly to client needs.

Why Wellington Businesses Are Making the Switch

Mid-tier accounting firms focus on personal interaction, quicker decision-making, and custom solutions, offering a balance between personalized service and professional capacity. They are large enough to handle complex financial requirements and small enough to give dedicated attention.

The shift is not simply about cost savings, though that remains a significant factor. Wellington business owners cite several compelling reasons for abandoning Big Four relationships. First among them is accessibility. At large firms, clients often find themselves handed off to junior associates, with senior partners appearing only for annual reviews or critical issues. Mid-tier alternatives assign experienced professionals who remain involved throughout the engagement, building institutional knowledge about the business and its unique challenges.

PKFWT chartered accountants in Auckland exemplify this approach by maintaining close relationships with clients across New Zealand’s business community. The firm’s model prioritizes continuity and deep understanding over volume-based billing structures.

Speed of response represents another critical advantage.

Mid-tier auditors run the same sophisticated analytics and risk assessments as Big Four firms but skip the global committees and three-tier review processes. Month-end closings that took weeks now wrap in days, and small teams with innovative tools handle complex consolidations.

Small Business Development Centers provide counseling and training to small businesses, delivering professional, high-quality, individualized business advising and technical assistance. SBDCs provide problem-solving assistance to help small businesses access capital, develop and exchange new technologies, and improve business planning, strategy, operations, and financial management. This government support infrastructure complements the personalized advisory services that mid-tier firms deliver.

The Economics Behind the Exodus

Mid-tier firms integrate technical excellence, flexibility, cost-effectiveness, and personalized care. They have structure, accountability, and reliability, unlike their counterparts in the freelance field or micro-firms, and yet they are affordable compared to the most expensive national firms.

The fee differential between Big Four and mid-tier firms has widened significantly in recent years. Large firms justify premium pricing through brand prestige and global reach, advantages that matter less to Wellington businesses focused primarily on domestic operations. Many business owners discovered during recent economic uncertainty that they were paying for capabilities they neither needed nor used.

Mid-tier firms structure their engagements differently. Rather than hourly billing that incentivizes longer project timelines, many offer fixed-fee arrangements based on defined scopes. This pricing transparency allows Wellington business owners to budget accurately and eliminates the anxiety of watching billable hours accumulate.

The Economic Census provides the most comprehensive measure of the U.S. economy, producing industry statistics at the national, state, and local levels. This information is used by businesses, policy makers, local governments, communities, individuals, students, and researchers for economic development, business decisions, and strategic planning. The data available through Census Bureau resources helps businesses understand industry benchmarks and make informed decisions about service provider selection.

Technology Levels the Playing Field

Boutique accounting firms figured out they don’t need billion-dollar proprietary platforms when cloud-based solutions deliver the same capabilities and enterprise-level analytics, automated evidence collection, and anomaly detection. These firms now handle 22% more clients than competitors using legacy systems while hitting 91% first-pass accuracy on tax filings.

The technology gap that once separated Big Four capabilities from smaller competitors has effectively closed. Modern cloud-based accounting platforms, data analytics tools, and AI-powered automation are available to firms of any size. Mid-tier firms have invested heavily in these systems, recognizing that technological sophistication represents a core competitive advantage.

This democratization of technology means Wellington business owners no longer sacrifice analytical capabilities when choosing mid-tier advisors. The same predictive modeling, real-time reporting, and automated compliance monitoring that Big Four firms offer are now standard across the industry.

Strategic advisory services have evolved significantly as well. Firms are expanding beyond traditional compliance work into areas like AI-powered digital transformation, technology implementation, and data strategy. Mid-tier firms excel in these emerging service lines because they can respond quickly to client needs without navigating layers of internal approval processes.

The Talent Migration Advantage

Mid-tier firms turned the accounting talent exodus into an opportunity. Senior managers and directors tired of Big Four burnout found firms offering growth potential, long-term client relationships, and work-life balance. Specialization became their secret weapon. While Big Four firms train generalists who rotate through industries, boutique firms build deep expertise in specific sectors.

Wellington’s mid-tier firms benefit from an ongoing talent shift in the accounting profession. Experienced professionals who spent years at Big Four firms are leaving for better work-life balance, earlier partnership opportunities, and more meaningful client relationships. This migration has strengthened mid-tier capabilities considerably, bringing Big Four training and methodology to more accessible service providers.

The expertise gap has narrowed as a result. Mid-tier firms now employ partners and senior managers with identical credentials and experience to those at larger competitors. What differs is the work environment and client engagement model, not the technical competence of the professionals involved.

What This Means for Wellington’s Business Community

Growth across the mid-tier continues. Almost all surveyed firms reported fee growth in their most recent financial year, and the vast majority expect growth to continue over the next three years. The top factors contributing to this growth are increased spend from existing clients, together with growth in fees from new clients.

The shift toward mid-tier advisors represents more than a simple preference change. It reflects a fundamental recalibration of what Wellington businesses value in professional service relationships. Accessibility, responsiveness, and fair pricing have proven more important than brand prestige for most small and medium-sized enterprises.

This trend shows no signs of reversing. As mid-tier firms continue expanding their capabilities and service offerings, the value proposition grows stronger. Business owners who made the switch report higher satisfaction levels, better communication, and improved financial outcomes compared to their Big Four experiences.

For Wellington’s entrepreneurial community, the message is clear: exceptional financial advisory services no longer require Big Four letterhead. Mid-tier firms have closed the capability gap while maintaining the personal touch and reasonable pricing that growing businesses need. The exodus from large firms toward more responsive alternatives will likely accelerate as word spreads about the quality of service available from Wellington’s expanding mid-tier accounting sector.

What the Oil Sector Slowdown Actually Did to Calgary’s Business Diversity

Calgary’s reputation as Canada’s energy capital survived the 2014 oil price collapse, but the city that emerged from that crisis looked fundamentally different. 

While headlines focused on job losses and office vacancies, a quieter transformation was reshaping the employment landscape. The slowdown forced a reckoning that decades of prosperity had postponed.

The Numbers Tell a Different Story

Between December 2014 and May 2016, approximately 43,000 jobs vanished from Alberta’s oil and gas sector.

Calgary’s unemployment rate peaked at over 10 percent in late 2016, with more than 90,000 people actively seeking work. Yet total employment in Alberta eventually returned to pre-downturn levels, suggesting something more complex than simple recovery was underway.

University of Calgary economist Trevor Tombe noted that only about seven percent of Albertans work in the oil and gas sector, a figure that surprises many residents who equate the city’s identity with petroleum. The major employers driving Calgary’s economy had already begun diversifying before the crisis hit, but the downturn accelerated changes that might have taken decades under different circumstances.

Since 2014, sectors offering high-wage employment of $30 and above saw about 100,000 jobs disappear, including construction down more than 45,000 jobs, mining and oil and gas down nearly 35,000, and professional services down 18,000. The loss wasn’t just numerical. It represented a fundamental shift in how Calgary’s economy generated wealth and opportunity.

Technology and Creative Industries Fill the Gap

While energy companies shed workers, other sectors expanded to absorb displaced talent.

More than 32,000 people are currently employed by 12,000 businesses in Calgary’s creative industries sector.

The video game industry employs 470 people, with 935 roles focused on immersive media, and the Digital Media & Entertainment employment rate is growing at an average annual rate of 4.8%.

The transformation required more than optimism.

Downtown office buildings that once housed oil workers were converted with putting greens and indoor dog parks to attract startups and tech companies that had no place in downtown Calgary before. This physical repurposing mirrored the broader economic recalibration happening across the city.

Digital transformation leadership became critical as companies from traditional sectors adopted technology-driven approaches to remain competitive. Film and television production emerged as an unexpected bright spot, with Calgary economic diversification efforts creating conditions for sustained growth beyond petroleum.

The Automation Factor Nobody Talks About

The oil sector jobs that disappeared weren’t all casualties of low prices.

Direct jobs in Canada’s oil and gas sector peaked in 2013 at 219,000, falling to 184,000 by 2023, while oil and gas production increased by 47% during the same period, from 5.7 million barrels of oil equivalent per day in 2012 to 8.4 million barrels per day in 2023.

This productivity gain through automation meant fewer workers produced more output, fundamentally altering the relationship between energy sector performance and regional employment.

In 2005, there were about 25 jobs per thousand barrels per day of oil equivalent, peaking in 2012 at 38 jobs per thousand barrels per day, before declining to 22 jobs per thousand barrels per day in 2023.

The implication was stark: even if oil prices recovered to boom-era levels, those jobs wouldn’t return. Companies had learned to operate more efficiently with smaller workforces, and shareholders expected that discipline to continue.

Healthcare and Construction Take the Lead

Oil and gas and mining combined accounted for just 175,000 jobs in Alberta, ranking as the fifth largest sector behind construction, healthcare and retail. This employment distribution existed even before the downturn, suggesting Calgary’s economy was more diversified than its reputation suggested.

In 2014, there were 1,635.8 thousand people employed in the services-producing sector, which steadily increased to 1754.8 thousand jobs by August 2019. Healthcare facilities, retail operations, and educational institutions continued hiring throughout the crisis, providing stability when energy sector volatility threatened to destabilize the entire regional economy.

Organizations like the Calgary Zoo reported being on track for the third best year in their history, selling a record number of memberships during the downturn. Consumer-facing businesses discovered that Calgary’s economy could function independently of oil prices if enough economic diversity existed to sustain household spending.

What Permanent Change Looks Like

Total employment returned to where it once was in 2014, and economists believed it might represent the beginning of the economic diversification Alberta had discussed for so long, though it hadn’t happened yet in a convincing way. The cautious assessment reflected uncertainty about whether changes would persist or reverse with the next commodity boom.

Successful implementation of Calgary’s Innovation Strategy is projected to add up to 187,000 jobs and contribute over $28 billion to the local economy by 2034. These projections depend on sustaining momentum built during crisis, when necessity forced innovation that prosperity might have discouraged.

The reality is that Calgary didn’t diversify away from oil and gas. It diversified around them, creating parallel economic engines that reduced vulnerability without abandoning the city’s competitive advantages in energy expertise. The slowdown revealed how much diversification had already occurred beneath the surface of a seemingly mono-industrial economy.

Total employment in Alberta’s oil and gas sector is only 75 percent what it was in 2014, while employment in construction is only 80 percent what it was then, and wages in the oilpatch no longer outpace other sectors the way they once did. These permanent structural changes define Calgary’s new economic reality more accurately than any recovery narrative based on commodity price rebounds.

The oil sector slowdown didn’t kill Calgary’s economy. It revealed an economy that had been slowly transforming for years, accelerating changes that would have occurred eventually. What emerges from the data is a portrait of resilience built on economic foundations more diverse than residents themselves realized, tested by crisis and validated by adaptation.

Best Packaging Services for Brands Expanding Internationally

Your packaging is the first thing a customer touches when they receive your product in a new country. Get that wrong, and you’re looking at a cascade of problems: materials that flunk local recycling rules, boxes that fall apart during longer shipping routes, costs that eat your profit margins alive, and compliance issues that stall your products at customs or rack up fines. Brands moving into international markets face three big packaging headaches at once: finding a supplier with actual manufacturing capacity or solid supplier networks in your target countries, making sure your packaging materials pass regulatory and sustainability checks in each destination, and keeping your brand looking consistent across markets without paying to manage a different supplier in every region. This guide walks through five packaging partners built for international expansion. You’ll see an accessible US-based e-commerce platform that ships worldwide, the biggest sustainable packaging company after a major acquisition, a protective packaging leader operating in 175 countries, a flexible and rigid packaging company across 40+ countries, and a 126-year-old packaging manufacturer serving 85+ nations.

How to Select the Best Packaging Services for International Expansion

We pulled this information in March 2026 from company websites, SEC filings, annual reports, and verified third-party sources to check each provider’s global reach, sustainability credentials, product lines, and recent business moves. Here’s what to look for:

  • Global Manufacturing Footprint: A packaging partner with manufacturing facilities or trusted supplier networks in your target markets cuts out the cost and compliance headaches of shipping packaging internationally; check for country-specific production capability before looking at anything else.
  • Regulatory and Sustainability Compliance: Packaging rules change from country to country; materials that get recycled easily in the US might be banned or need different labels in the EU, Japan, or Australia; make sure the supplier has compliance documentation and regulatory support for each specific market.
  • Scalability Across Order Volumes: Brands entering new markets usually start small and grow fast; a partner who can handle both a 50-unit test order and a 50,000-unit production run saves you from switching suppliers mid-growth.
  • Multi-Format Capability: International expansion often calls for different packaging formats by region; flexible pouches might work in one market while rigid containers dominate another; one partner covering corrugated, flexible, rigid, and protective formats across markets keeps things simple.
  • Sustainability Credentials for Target Markets: European, Australian, and many Asian markets have strict packaging recyclability, recycled content, and carbon disclosure requirements; check that the supplier’s materials carry the third-party certifications your retail buyers or e-commerce platforms require in each new market.

List of Best Packaging Services for Brands Expanding Internationally

Here are five packaging partners with different strengths for international growth:

  1. Arka
  2. International Paper
  3. Sealed Air
  4. Amcor
  5. Sonoco

Best Packaging Services for Brands Expanding Internationally

1. Arka

  • Founded: Phillip Akhzar launched Arka in 2015 from San Francisco, California, and the company now supports 2,000+ clients across 950 cities globally.
  • MOQ & Pricing: You can order as few as 10 units, custom shipping boxes start at $0.99 each, standard production runs 7 to 10 business days, and rush orders ship in 3 to 6 business days.
  • Materials: All paper products are FSC Chain of Custody certified, with compostable and post-consumer recycled options available, plus full-coverage CMYK digital printing on every product.
  • Products: The product line includes custom mailer boxes, shipping boxes, product boxes, folding cartons, compostable poly mailers, 100% recycled bubble mailers, tissue paper, and void fill.
  • International Reach: Arka ships to international addresses, integrates with Shopify API and WMS platforms for automated stock replenishment, and includes instant online proofing with every custom order.

Arka launched in 2015 in San Francisco to solve packaging problems for growing e-commerce and DTC brands. The company offers FSC-certified, compostable, and recycled material options starting at just 10 units from $0.99 each, ships internationally, and plugs into Shopify for automated restocking. Arka doesn’t play at the same scale as the enterprise suppliers in this guide, but its low MOQ, instant proofing system, and international delivery make it a smart starting point for brands testing packaging in new markets before locking into high-volume production contracts.

Best For: DTC and e-commerce brands in the early stages of international expansion who need FSC-certified, low-MOQ branded packaging with international shipping and Shopify integration to test new markets without committing to large volumes.

Standout Feature: 10-unit MOQ from $0.99 per unit with FSC-certified sustainable materials, international shipping, and Shopify API integration makes this the easiest entry point in this guide for brands testing packaging across new international markets.

2. International Paper

  • Founded: International Paper started in 1898 and operates from Memphis, Tennessee, USA, with EMEA headquarters now in London, UK after acquiring DS Smith.
  • Scale: The company’s $7.2 billion DS Smith acquisition closed on January 31, 2025, and the combined business now employs 65,000+ people with operations in 30+ countries.
  • Revenue: Net sales for 2024 hit $18.6 billion, and the DS Smith acquisition created a global leader in sustainable packaging solutions across North America and EMEA.
  • Products: The product range covers corrugated packaging, solid fiber products, bulk packaging, retail displays, corrugated sheets, and recycling solutions, plus structural design, graphic design, fulfillment, and supply chain services.
  • Sustainability: The company runs 200+ box plants in North America, operates closed-loop sustainability and commercial recycling programs, and employs 200+ packaging design engineers across Europe and the USA working from standardized CAD systems.

International Paper launched in 1898 from Memphis, Tennessee, and just wrapped up a $7.2 billion buyout of UK-based DS Smith in January 2025. That deal created a global sustainable packaging leader with 65,000+ employees working in 30+ countries across North America and EMEA. With 2024 net sales of $18.6 billion, 200+ box plants, and a team of packaging design engineers running standardized CAD systems across Europe and the US, the combined operation gives brands expanding internationally access to fiber-based corrugated packaging, structural design, supply chain optimization, and closed-loop recycling across two of the biggest packaging markets on the planet.

Best For: Enterprise brands and large-scale manufacturers expanding into North America and EMEA markets who need a vertically integrated corrugated packaging partner with local box plants, design engineering, and supply chain management across 30+ countries.

Standout Feature: The 2025 DS Smith acquisition created a single supplier covering 30+ countries across North America and EMEA under one company, the broadest combined corrugated packaging footprint in this guide for brands operating across both regions.

3. Sealed Air

  • Founded: Alfred W. Fielding and Marc Chavannes founded Sealed Air in 1960 in New Jersey after inventing Bubble Wrap®, and the company now operates from Charlotte, North Carolina.
  • Scale: The company employs over 25,000 people serving customers in 175 countries, reported 2024 revenues of $5.4 billion (NYSE: SEE), and agreed to a $10.3 billion total enterprise value acquisition by private equity firm Clayton, Dubilier & Rice announced in November 2025.
  • Brands: The portfolio includes Bubble Wrap®, Cryovac®, Autobag®, LiquiBox®, and the Sealed Air brand, all recognized across global markets.
  • Segments: Sealed Air operates through Food and Protective segments; food packaging covers fresh red meat, poultry, seafood, plant-based products, fluids, and cheese; the protective segment covers e-commerce, consumer goods, pharmaceutical, and industrial manufacturing.
  • Services: Services include fulfillment design and engineering, shrink machinery upgrades, ship-from-anywhere services, automated packaging systems, and graphic design services across global markets.

Sealed Air started in 1960 in New Jersey when the inventors of Bubble Wrap® decided to turn their innovation into a business. Over 65 years, it grew into a global packaging solutions company with $5.4 billion in 2024 revenues, 25,000+ employees, and customers in 175 countries. The company’s globally recognized brands like Bubble Wrap®, Cryovac®, Autobag®, and LiquiBox® operate across the Americas, Europe, Middle East, Africa, Asia, Australia, and New Zealand through Food and Protective business segments. In November 2025, Clayton, Dubilier & Rice announced an agreement to buy Sealed Air for a total enterprise value of $10.3 billion.

Best For: Brands in food, e-commerce, pharmaceutical, and industrial manufacturing sectors expanding internationally who need a globally recognized, multi-segment protective and food packaging partner with established operations across 175 countries.

Standout Feature: Globally recognized brands across 175 countries spanning both Food (Cryovac®) and Protective (Bubble Wrap®, Autobag®) segments gives this company the broadest single-company international customer reach in this guide for cross-category packaging needs.

4. Amcor

  • Founded: Amcor’s roots trace back to Australian paper mills established in the 1860s, rebranded as Amcor Limited in 1986, and is now domiciled in Jersey, Switzerland, with dual listings on NYSE: AMCR and ASX: AMC.
  • Scale (FY2024): The company employs 41,000 people, reported $13.6 billion in annual sales, operates 212 locations across 40 countries, and projects combined annualized sales of approximately $23 billion after completing the Berry Global acquisition on April 30, 2025.
  • Sustainability Pledge: Amcor committed to making all packaging recyclable, reusable, or compostable by the end of fiscal year 2025, reached 87% of products meeting that standard by the end of FY2024, employs 1,500+ R&D professionals, and invests approximately $180 million annually in R&D after the acquisition.
  • Products: The product line covers flexible packaging, rigid containers, specialty cartons, closures, and services for food, beverage, pharmaceutical, medical, home and personal care across four Flexibles business units: EMEA, Americas, Asia Pacific, and Specialty Cartons.
  • Industries: Amcor serves food, beverage, pharmaceutical, medical devices, home and personal care, and other markets for globally recognized consumer brands and works to protect products, differentiate brands, and improve supply chains.

Amcor started in Australian paper mills back in the 1860s, took the Amcor Limited name in 1986, and has grown into a global flexible and rigid packaging leader with $13.6 billion in FY2024 sales across 212 locations in 40 countries. Combined annualized sales are projected at approximately $23 billion after wrapping up the Berry Global acquisition in April 2025. The company produces flexible packaging, rigid containers, specialty cartons, closures, and services across four regional Flexibles business units covering EMEA, Americas, Asia Pacific, and Specialty Cartons, serving food, beverage, pharmaceutical, and medical brands across 140+ countries.

Best For: Consumer goods, food, beverage, and pharmaceutical brands expanding globally who need a flexible and rigid packaging partner with operations across 40 countries, $23 billion in combined scale, and a documented 2025 recyclability pledge.

Standout Feature: A documented 2025 Pledge to make all packaging recyclable, reusable, or compostable with 87% of products already meeting that standard by end of FY2024, backed by 1,500+ R&D professionals and approximately $180M annual R&D investment after the Berry Global acquisition.

5. Sonoco

  • Founded: Sonoco launched in 1899 as Southern Novelty Company in Hartsville, South Carolina, has operated for 126 years, trades on NYSE: SON, and is South Carolina’s largest corporation by sales.
  • Scale: The company employs approximately 19,900 people, operates 335+ facilities in 33 countries, serves 85+ nations, and reports annualized net sales of approximately $7.3 billion.
  • World Record: Sonoco is the world’s largest producer of composite cans, tubes, and cores and the only producer of both two-piece and three-piece aerosol cans.
  • Products: Product offerings include rigid paper containers, composite cans, paperboard tubes and cores, metal ends, flexible packaging, thermoformed plastics, protective packaging, and industrial paper packaging serving food, beverage, household, personal care, pharmaceutical, and industrial markets.
  • Certifications: Sonoco holds FSC®-C011144, Sustainable Forestry Initiative® (SFI-00390), and PEFC/29-31-248 Chain of Custody certifications across US, Canadian, UK, Brazilian, and Mexican mills.

Sonoco was founded in 1899 in Hartsville, South Carolina, and has been operating for 126 years, growing into a global packaging leader with 19,900 employees and 335+ operations in 33 countries serving 85+ nations. The company holds a unique spot in the market as the world’s largest producer of composite cans, tubes, and cores and the only producer of both two-piece and three-piece aerosol cans. Sonoco serves food, beverage, household, personal care, pharmaceutical, and industrial markets with FSC, SFI, and PEFC Chain of Custody certifications across mills in the US, Canada, UK, Brazil, and Mexico.

Best For: Brands in food, beverage, personal care, household, and pharmaceutical markets expanding internationally who need a 126-year-old, FSC-certified industrial and consumer packaging manufacturer with proven operations across 33 countries and a unique position in composite and aerosol packaging.

Standout Feature: 126 years of continuous operation combined with unique world-leading positions as the world’s largest producer of composite cans, tubes, and cores and the only producer of both two-piece and three-piece aerosol cans with FSC, SFI, and PEFC certifications across five countries.

Factors to Consider When Choosing a Packaging Service for International Expansion

In-Country Manufacturing vs. Cross-Border Shipping

Packaging made in a supplier’s home country and shipped internationally adds freight costs, longer lead times, customs paperwork, and damage risk that local production avoids entirely. Before you pick a global packaging partner, check whether they actually have manufacturing capacity or vetted regional supplier networks in your specific target markets, not just a general claim about global operations.

Destination Market Regulatory Compliance

Packaging rules change dramatically from one country to another. The EU’s Packaging and Packaging Waste Regulation, Japan’s Containers and Packaging Recycling Law, and Australia’s National Packaging Targets each set different requirements for materials, labels, and recyclability. Make sure your packaging partner has documented compliance expertise for each specific destination market before production starts, rather than assuming a globally active supplier automatically knows local regulatory requirements.

Sustainability Certifications Required by Retail Buyers

Big international retailers, especially in Europe and Australia, increasingly demand third-party sustainability certifications like FSC, SFI, PEFC, or verified recyclability claims as a condition of stocking your products. Check that your packaging supplier’s materials carry the specific certifications required by the retail buyers or e-commerce platforms you plan to sell through in each new market, since a supplier’s general sustainability talk doesn’t always translate into the specific documentation buyers actually need.

Volume Scalability Across Markets

International expansion rarely hits predicted volumes in year one. A packaging partner who can handle a 50-unit market test and a 500,000-unit production peak under the same commercial relationship saves you from switching suppliers mid-growth. Confirm the supplier’s MOQ, volume pricing tiers, and capacity commitment protocols before signing a multi-market agreement.

Supply Chain Redundancy for Cross-Border Resilience

Single-source packaging production creates serious supply chain risk for international brands. Port delays, raw material shortages, or facility problems that a domestic brand could manage might completely halt international operations. Check whether the packaging partner has multi-facility redundancy across regions or whether your supply agreement includes contingency sourcing provisions for high-volume international orders.

Final Thoughts

Before you commit to a packaging partner for international expansion, request physical samples produced from the specific facilities that will actually serve your target markets. A supplier’s global headquarters might run different quality standards than regional facilities, so verify surface finish, print quality, and structural integrity from the actual production source before placing your first real order. Match the scale of the packaging partner to your actual current volume, not your hoped-for peak numbers. An enterprise manufacturer with high MOQs and long lead times makes no sense for a brand entering a new market with a 500-unit test order, no matter how good their global footprint looks. Always check that sustainability certifications and regulatory compliance documentation cover the specific materials and formats you plan to use in each target country. General company-level sustainability claims don’t always cover every product in a supplier’s catalog.